4/11/2017

I’m here today, just in the library (we may move if the A/C doesn’t kick in soon).

Today is the day that our infographic is due, so make sure that you get it turned in. All you need to do is download your infographic as a jpeg and turn that file into Google Classroom. MAKE SURE YOU SUBMIT IT IN GOOGLE CLASSROOM RATHER THAN JUST SHARING IT WITH ME.

If you need help, please e-mail me and I’ll probably be able to sneak down to the classroom. 🙂 Probably. Unless it’s

4/7/2017

I wasn’t here today, but I’m hoping you did the work that I left for you: the research reflection questions. Do them on paper, turn them into the sub, and then work on your infographic. You can e-mail me – I will be sporadically checking my e-mail during the day.

The reflection questions that I left are part of the rubric for the Infographic.

4/6/17

Today was just a work day. I am still missing a LOT of research, especially in 6th period. What gives?

A few things I’ve been seeing as I’ve been hovering around and creeping on your projects:

  • Some of you guys are doing AMAZING things! As I am in shock and awe. I am sorry I underestimated your ability to create an infographic! I am LOVING it!
  • Ms. Butler (the KO technology gooru) found a really neat site about Piktochart hacks in case you really want to WOW me!
  • The biggest issue I’m now seeing is how to transform a HUGE CHUNK OF TEXT into manageable words and phrases. Most of the time, that means chunking each idea with a picture. Look at my example (research and infographic) as a model.

The end of the grading period is next Thursday. Get on the graduation choo-choo train!

Image result for thomas the tank engine goes to school

4/5/2017

We worked more on the infographic today. I’m working on mine, too. I got a lot done today, too! Look at my progress!

A few things that I pointed out to people today:

  • Under tools, check out the charts and maps. These are really cool ways to visually represent information and they are easy to manipulate!
  • Under Text, check out the Text Frames. You won’t be able to change the colors, but there are some neat pre-made visuals!
  • Under graphics, look at Photo Frames! Really creative way to insert pictures that you upload

4/4/2017

Today, we created accounts with Piktochart. I’ve used this in the past for personal projects and class assignments, so I can generally help you when you have questions. Here is the infographic that I made when I was on the job hunt – I originally planned on making my resume into an infographic, but that was taking too long and making me cranky, so I just made this, instead.

Create the account using your KISD Google account. When you get the conformation e-mail you will need to COPY/PASTE the link they send you. Do not just click it – you will not be able to open it up. If you clink it multiple times, it will say that you have already authenticated your account.

You will create an INFOGRAPHIC. Make sure that you use a template rather than the blank document. It’s easier, I promise. You can edit pretty much everything. There are a few limitations, however, because it’s a free account, but stick to the free account. Please.

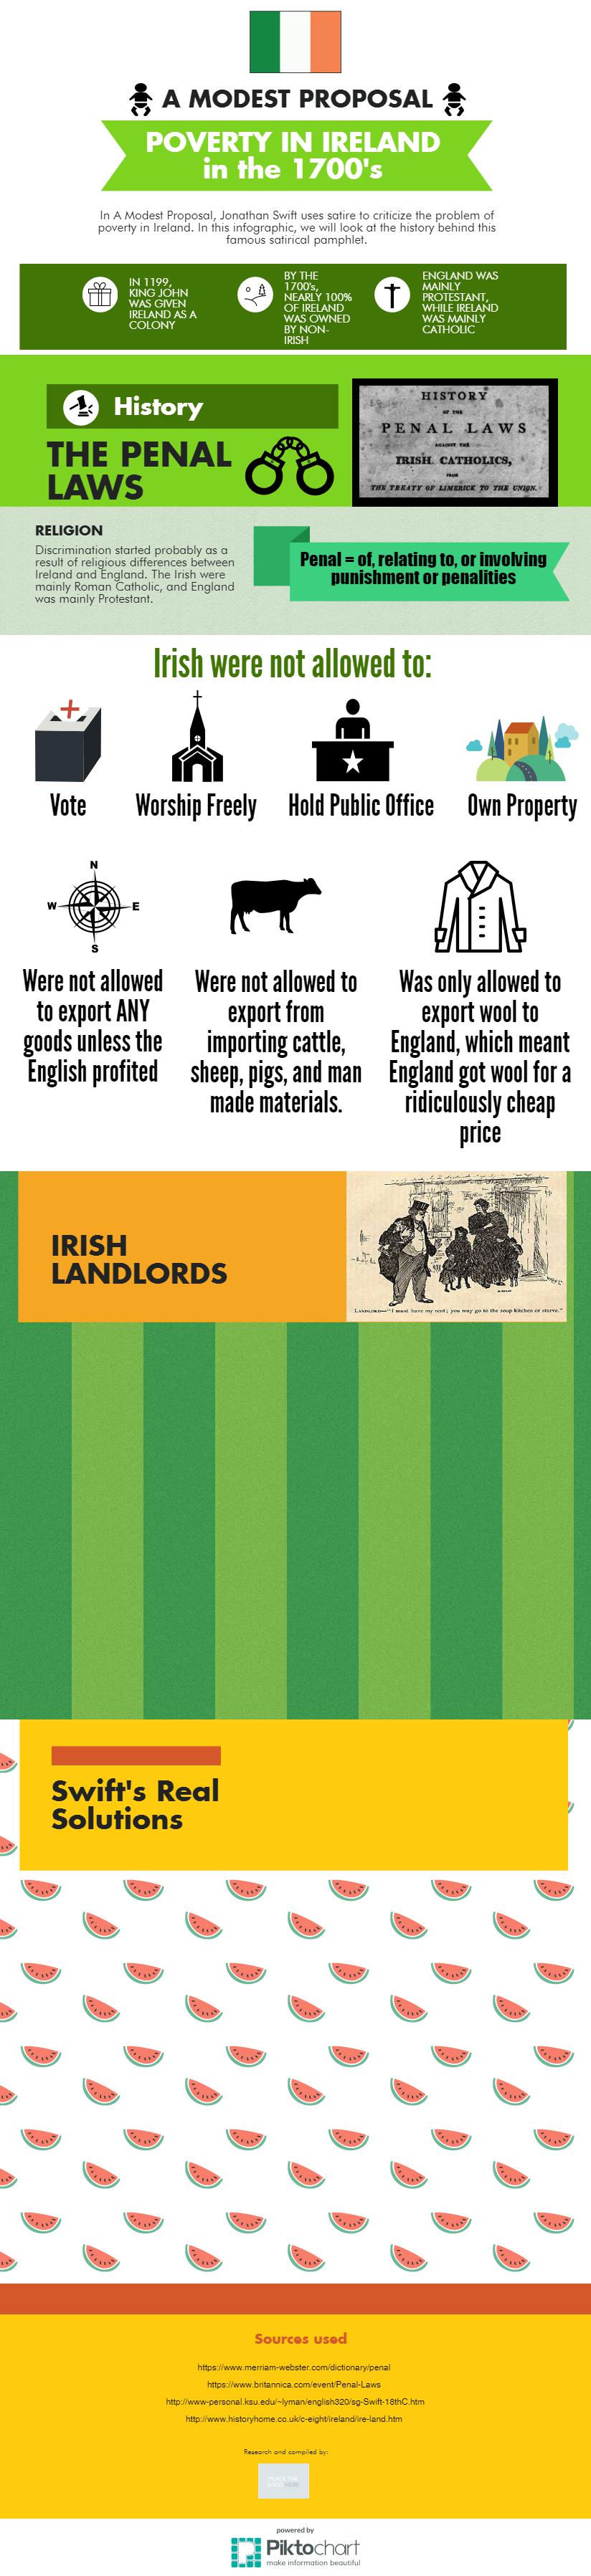
As I have already said, I do everything that I ask you guys to do, so here is my infographic based on the research that I did.

This is the amount 0f work that I got done in on class period:
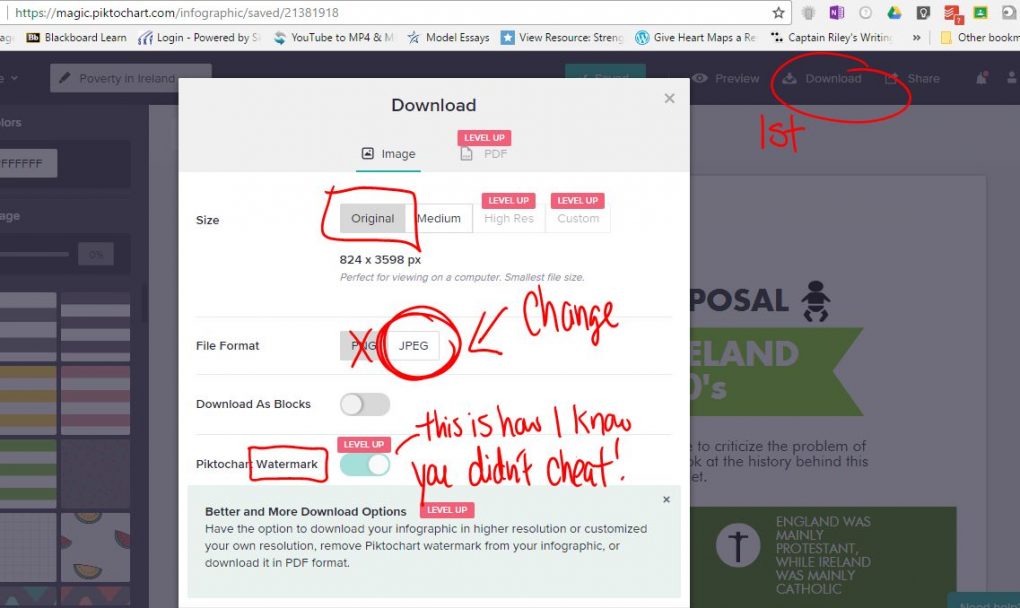
A few notes:

Don’t get distracted by the “blocks” – that was the most frustrating part of Piktochart when I first started playing around with it. Just think of it as pages, or slides in PowerPoint.

Here the rubric – this is what I will be specifically grading for this Infographic. This should be based on the research that you did last week.